🌐 EGS Installer
🚀 EGS Installer Documentation 🚀
The online documentation provides enhanced navigation, better formatting, and the latest updates.
📑 Table of Contents
| Section | Description |
|---|---|
| 📚 Documentation | All documentation links and guides |
| 🚀 Overview | Installation methods comparison |
| Getting Started | Prerequisites and initial setup |
| ⚡ Quick Installer | Single-command installation |
| 📋 Config-Based Installer | YAML configuration-based installation |
| 🛠️ Config-Based Installation Steps | Step-by-step configuration guide |
| 🌐 Multi-Cluster Setup | Multi-cluster deployment guide |
| 🗑️ Uninstallation | How to uninstall EGS |
| 📋 Quick Reference | Commands and operations summary |
| 📦 Airgap Deployment | Offline/airgap installation |
📚 Documentation
| Category | Document | Description |
|---|---|---|
| 🔑 License | EGS License Setup | License configuration guide |
| ⚡ Quick Start | Quick Install Guide | Single-command installer with all options |
| 📋 Configuration | Configuration Reference | Config-based installer detailed reference |
| 🌐 Multi-Cluster | Multi-Cluster Example | Complete multi-cluster YAML example |
| 📋 Prerequisites | Controller Prerequisites | Controller cluster requirements |
| 📋 Prerequisites | Worker Prerequisites | Worker cluster requirements |
| 🗂️ Setup | Namespace Creation | Pre-create namespaces script |
| ✅ Validation | Preflight Check | Pre-installation validation |
| 🔧 Operations | Slice & Admin Token | Token retrieval guide |
| 💰 Operations | Custom Pricing | Custom pricing configuration |
| 🔐 Security | Prometheus TLS Authentication | TLS setup for Prometheus |
| 📦 Airgap | Airgap Image Management | Airgap image pull and push |
📚 User Guide: docs.avesha.io/documentation/enterprise-egs
🚀 Overview
The EGS Installer provides installation methods for deploying EGS components into Kubernetes clusters:
| Method | Best For | Description | Documentation |
|---|---|---|---|
| ⚡ Quick Installer | New users, PoC, simple setups | Single-command installer with auto-configuration, skip flags, and multi-cluster support | 📖 Quick Install Guide |
| 📋 Config-Based Installer | Production, teams, advanced setups | Version-controlled YAML configuration for repeatable, auditable installs | 📖 Configuration Reference |
All methods leverage Helm for package management, kubectl for Kubernetes interaction, and yq for YAML parsing.
Getting Started
Prerequisites
Before installation, ensure the following:
1. 📝 Registration
Complete the registration at Avesha EGS Registration to receive:
- Access credentials
- Product license file (
egs-license.yaml)
📖 See EGS License Setup for detailed instructions.
2. 🔧 Required Binaries
Verify these tools are installed and in your PATH:
| Binary | Minimum Version |
|---|---|
| yq | 4.44.2 |
| helm | 3.15.0 |
| kubectl | 1.23.6 |
| jq | 1.6.0 |
3. 🌐 Kubernetes Access
Confirm administrative access to target clusters with appropriate kubeconfig files.
4. 📂 Clone Repository
git clone https://github.com/kubeslice-ent/egs-installation
cd egs-installation
5. 🔗 KubeSlice Networking (Optional)
Note: KubeSlice networking is disabled by default (
kubesliceNetworking: enabled: false).
If enabling KubeSlice networking, ensure gateway nodes are labeled:
kubectl get nodes -l kubeslice.io/node-type=gateway
The installer can auto-label nodes when add_node_label: true is configured.
6. ✅ Preflight Check (Optional)
Validate your environment before installation:
./egs-preflight-check.sh --kubeconfig ~/.kube/config --kubecontext-list context1,context2
📖 See Preflight Check Guide for details.
7. 🗂️ Pre-create Namespaces (Optional)
For clusters with namespace policies:
./create-namespaces.sh --input-yaml namespace-input.yaml --kubeconfig ~/.kube/config
📖 See Namespace Creation Guide for details.
⚡ Quick Installer
New to EGS? Start here with our single-command installer!
Basic Installation
curl -fsSL https://repo.egs.avesha.io/install-egs.sh | bash -s -- \
  --license-file egs-license.yaml --kubeconfig ~/.kube/config
Common Commands
| Scenario | Command |
|---|---|
| Single-cluster (full) | curl -fsSL https://repo.egs.avesha.io/install-egs.sh \| bash -s -- --license-file egs-license.yaml --kubeconfig ~/.kube/config |
| Skip prerequisites | Add --skip-postgresql --skip-prometheus --skip-gpu-operator |
| Multi-cluster | Add --controller-kubeconfig <ctrl.yaml> --worker-kubeconfig <wkr.yaml> |
| Register worker | --register-worker --controller-kubeconfig <ctrl.yaml> --register-cluster-name <name> --register-project-name avesha |
📝 Registration Required
Complete the registration process at Avesha EGS Registration to receive your license file (egs-license.yaml).
📖 For complete Quick Installer documentation including topology examples, multi-cluster setup, worker registration, and all options:
→ View Full Quick Install Guide
📋 Config-Based Installer
For production environments where you need version-controlled, auditable configurations.
The Config-Based Installer uses egs-installer.sh with a managed egs-installer-config.yaml file. This approach is recommended when you need:
- Multiple config files per environment, customer, or cluster topology
- Fine-grained control over all installation parameters
- Version-controlled, auditable installation configurations
- Complex multi-cluster setups with custom monitoring endpoints
📖 Detailed configuration documentation: Configuration Reference
🛠️ Config-Based Installation Steps
Using Quick Installer? See the Quick Install Guide instead.
Step 1: Configure Prerequisites
⚙️ Choose ONE approach:
🅰️ Option A: EGS-Managed Prerequisites (Recommended)
Let EGS install Prometheus, GPU Operator, and PostgreSQL:
# egs-installer-config.yaml
global_kubeconfig: "path/to/kubeconfig"    # Required - Path to your kubeconfig file
global_kubecontext: "your-context"         # Required - Context to use
use_global_context: true

enable_install_controller: true
enable_install_ui: true
enable_install_worker: true
enable_install_additional_apps: true       # Enables prerequisites (PostgreSQL, Prometheus, GPU Operator)
enable_custom_apps: false                  # Set true for NVIDIA drivers on GKE
run_commands: false                        # Set true for MIG configuration
add_node_label: true                       # Auto-label gateway nodes
Run prerequisites installer:
./egs-install-prerequisites.sh --input-yaml egs-installer-config.yaml
🅱️ Option B: Pre-existing Infrastructure
If you have Prometheus, GPU Operator, or PostgreSQL already running:
- Set
enable_install_additional_apps: false - See EGS Controller Prerequisites for Prometheus/PostgreSQL configuration
- See EGS Worker Prerequisites for GPU Operator/monitoring configuration
Step 2: Configure Controller
📝 PostgreSQL Note: KubeTally is enabled by default and requires PostgreSQL. If using EGS-managed PostgreSQL (
enable_install_additional_apps: true), the default configuration below works automatically. If using your own PostgreSQL, update thekubeTallysection with your PostgreSQL connection details.
kubeslice_controller_egs:
  skip_installation: false
  use_global_kubeconfig: true
  specific_use_local_charts: true
  kubeconfig: ""                               # Empty = uses global_kubeconfig
  kubecontext: ""                              # Empty = uses global_kubecontext
  namespace: "kubeslice-controller"
  release: "egs-controller"
  chart: "kubeslice-controller-egs"
  inline_values:
    global:
      imageRegistry: harbor.saas1.smart-scaler.io/avesha/aveshasystems
      kubeTally:
        enabled: true
        # PostgreSQL Configuration - Update if using your own PostgreSQL
        postgresSecretName: kubetally-db-credentials
        existingSecret: false                  # Set true if using pre-created secret
        postgresAddr: "kt-postgresql.kt-postgresql.svc.cluster.local"
        postgresPort: 5432
        postgresUser: "postgres"
        postgresPassword: "postgres"
        postgresDB: "postgres"
        postgresSslmode: disable
        prometheusUrl: http://prometheus-kube-prometheus-prometheus.egs-monitoring.svc.cluster.local:9090
    kubeslice:
      controller:
        endpoint: ""                           # Auto-fetched if empty
        replication:
          minio:
            install: "true"
            storage: 1Gi
            username: minioadmin
            password: minioadmin
            service:
              type: "LoadBalancer"
    serviceMonitor:
      enabled: true
      namespace: egs-monitoring
  helm_flags: "--wait --timeout 5m --debug"
  verify_install: false
  verify_install_timeout: 30
📖 See egs-installer-config.yaml for complete example.
PostgreSQL Configuration Options
| Scenario | Configuration |
|---|---|
| EGS-Managed PostgreSQL | Use defaults above. PostgreSQL installed via enable_install_additional_apps: true |
| Pre-existing PostgreSQL | Update postgresAddr, postgresPort, postgresUser, postgresPassword, postgresDB with your values |
| Pre-created Secret | Set existingSecret: true, leave other postgres fields empty, ensure secret exists in kubeslice-controller namespace |
📖 See EGS Controller Prerequisites for detailed PostgreSQL setup.
Step 3: Configure UI (Optional)
The UI typically requires no changes from defaults.
kubeslice_ui_egs:
  skip_installation: false
  use_global_kubeconfig: true
  kubeconfig: ""                               # Empty = uses global_kubeconfig
  kubecontext: ""                              # Empty = uses global_kubecontext
  namespace: "kubeslice-controller"
  release: "egs-ui"
  chart: "kubeslice-ui-egs"
  specific_use_local_charts: true
  inline_values:
    global:
      imageRegistry: harbor.saas1.smart-scaler.io/avesha/aveshasystems
    kubeslice:
      prometheus:
        url: http://prometheus-kube-prometheus-prometheus.egs-monitoring.svc.cluster.local:9090
      uiproxy:
        service:
          type: LoadBalancer                   # Use NodePort if LoadBalancer unavailable
      apigw:
        env:
          - name: DCGM_METRIC_JOB_VALUE
            value: nvidia-dcgm-exporter        # Must match Prometheus scrape job name
      egsCoreApis:
        enabled: true
  helm_flags: "--wait --timeout 5m --debug"
  verify_install: false
📖 See egs-installer-config.yaml for complete example.
Step 4: Configure Workers
kubeslice_worker_egs:
  - name: "worker-1"                           # Must match cluster_registration
    use_global_kubeconfig: true
    kubeconfig: ""                             # Empty = uses global_kubeconfig
    kubecontext: ""                            # Empty = uses global_kubecontext
    skip_installation: false
    specific_use_local_charts: true
    namespace: "kubeslice-system"
    release: "egs-worker"
    chart: "kubeslice-worker-egs"
    inline_values:
      global:
        imageRegistry: harbor.saas1.smart-scaler.io/avesha/aveshasystems
      kubesliceNetworking:
        enabled: false                         # Set true if using KubeSlice networking
      operator:
        env:
          - name: DCGM_EXPORTER_JOB_NAME
            value: gpu-metrics                 # Must match Prometheus scrape job name
      egs:
        prometheusEndpoint: "http://prometheus-kube-prometheus-prometheus.egs-monitoring.svc.cluster.local:9090"
        grafanaDashboardBaseUrl: "http://<grafana-lb>/d/Oxed_c6Wz"
      egsGpuAgent:
        env:
          - name: REMOTE_HE_INFO
            value: "nvidia-dcgm.egs-gpu-operator.svc.cluster.local:5555"
          - name: HEALTH_CHECK_INTERVAL
            value: "15m"
      monitoring:
        podMonitor:
          enabled: true
          namespace: egs-monitoring
    helm_flags: "--wait --timeout 5m --debug"
    verify_install: true
    verify_install_timeout: 60
📖 See egs-installer-config.yaml for complete example.
Step 5: Configure Cluster Registration
cluster_registration:
  - cluster_name: "worker-1"                   # Must match worker name
    project_name: "avesha"
    telemetry:
      enabled: true
      endpoint: "http://prometheus-kube-prometheus-prometheus.egs-monitoring.svc.cluster.local:9090"
      telemetryProvider: "prometheus"
    geoLocation:
      cloudProvider: ""                        # e.g., "GCP", "AWS", "azure"
      cloudRegion: ""                          # e.g., "us-central1", "us-east-1"
📖 See Multi-Cluster Example for multi-cluster registration.
Step 6: Configure Additional Applications (When enable_install_additional_apps: true)
If you set enable_install_additional_apps: true, configure the additional_apps section for PostgreSQL, Prometheus, and GPU Operator:
additional_apps:
  # GPU Operator - Required for GPU workloads
  - name: "gpu-operator"
    skip_installation: false
    use_global_kubeconfig: true
    kubeconfig: ""
    kubecontext: ""
    namespace: "egs-gpu-operator"
    release: "gpu-operator"
    chart: "gpu-operator"
    repo_url: "https://helm.ngc.nvidia.com/nvidia"
    version: "v25.3.4"
    specific_use_local_charts: true
    inline_values:
      hostPaths:
        driverInstallDir: "/home/kubernetes/bin/nvidia"
      toolkit:
        installDir: "/home/kubernetes/bin/nvidia"
      cdi:
        enabled: true
        default: true
      driver:
        enabled: false                         # Set true if nodes need NVIDIA drivers
    helm_flags: "--debug"
    verify_install: false
    verify_install_timeout: 600

  # Prometheus - Required for monitoring
  - name: "prometheus"
    skip_installation: false
    use_global_kubeconfig: true
    kubeconfig: ""
    kubecontext: ""
    namespace: "egs-monitoring"
    release: "prometheus"
    chart: "kube-prometheus-stack"
    repo_url: "https://prometheus-community.github.io/helm-charts"
    version: "v45.0.0"
    specific_use_local_charts: true
    inline_values:
      prometheus:
        service:
          type: ClusterIP
        prometheusSpec:
          additionalScrapeConfigs:
            - job_name: gpu-metrics
              scrape_interval: 1s
              metrics_path: /metrics
              kubernetes_sd_configs:
                - role: endpoints
                  namespaces:
                    names:
                      - egs-gpu-operator
      grafana:
        enabled: true
    helm_flags: "--debug"
    verify_install: false

  # PostgreSQL - Required for KubeTally
  - name: "postgresql"
    skip_installation: false
    use_global_kubeconfig: true
    kubeconfig: ""
    kubecontext: ""
    namespace: "kt-postgresql"
    release: "kt-postgresql"
    chart: "postgresql"
    repo_url: "oci://registry-1.docker.io/bitnamicharts/postgresql"
    version: "16.7.27"
    specific_use_local_charts: true
    inline_values:
      auth:
        postgresPassword: "postgres"
        username: "postgres"
        password: "postgres"
        database: "postgres"
      primary:
        persistence:
          enabled: true
          size: 10Gi
    helm_flags: "--debug"
    verify_install: false
📖 See egs-installer-config.yaml for complete additional_apps configuration.
⚠️ Multi-Cluster Note: For multi-cluster setups, you need additional entries for each worker cluster with their specific kubeconfig and kubecontext. See Multi-Cluster Example.
Step 7: Configure Projects (Optional)
Projects provide logical grouping for clusters. Default project avesha is created automatically:
projects:
  - name: "avesha"
    username: "admin"
Step 8: Configure Manifests and Commands (When enable_custom_apps: true)
If you set enable_custom_apps: true for NVIDIA driver installation or MIG configuration:
# Manifests for GPU quota and NVIDIA driver
manifests:
  - appname: "gpu-operator-quota"
    use_global_kubeconfig: true
    namespace: "egs-gpu-operator"
    skip_installation: false
    inline_yaml: |
      apiVersion: v1
      kind: ResourceQuota
      metadata:
        name: gpu-operator-quota
        namespace: egs-gpu-operator
      spec:
        hard:
          pods: "100"
        scopeSelector:
          matchExpressions:
            - operator: In
              scopeName: PriorityClass
              values:
                - system-node-critical
                - system-cluster-critical

  - appname: "nvidia-driver-installer"
    use_global_kubeconfig: true
    namespace: "kube-system"
    skip_installation: false
    manifest: "https://raw.githubusercontent.com/GoogleCloudPlatform/container-engine-accelerators/master/nvidia-driver-installer/cos/daemonset-preloaded.yaml"

# Commands for NVIDIA MIG configuration (when run_commands: true)
commands:
  - use_global_kubeconfig: true
    skip_installation: false
    namespace: kube-system
    command_stream: |
      kubectl create namespace egs-gpu-operator --dry-run=client -o yaml | kubectl apply -f - || true
      kubectl get nodes -o json | jq -r '.items[] | select(.status.capacity["nvidia.com/gpu"] != null) | .metadata.name' | xargs -I {} kubectl label nodes {} gke-no-default-nvidia-gpu-device-plugin=true cloud.google.com/gke-accelerator=true --overwrite || true
📖 See egs-installer-config.yaml for complete manifests and commands configuration.
Step 9: Configure Monitoring Endpoints (Multi-Cluster)
For multi-cluster setups, configure automatic endpoint fetching:
# Global monitoring endpoint settings
global_auto_fetch_endpoint: true               # Auto-fetch Prometheus/Grafana endpoints
global_grafana_namespace: egs-monitoring
global_grafana_service_type: ClusterIP         # Use LoadBalancer for multi-cluster
global_grafana_service_name: prometheus-grafana
global_prometheus_namespace: egs-monitoring
global_prometheus_service_name: prometheus-kube-prometheus-prometheus
global_prometheus_service_type: ClusterIP      # Use LoadBalancer for multi-cluster
⚠️ Multi-Cluster Critical: For multi-cluster setups where controller and workers are in different clusters, you must use LoadBalancer or NodePort service types. ClusterIP only works for single-cluster setups.
Step 10: Additional Configuration Options (Optional)
These optional settings are available in egs-installer-config.yaml:
| Setting | Description | Default |
|---|---|---|
global_image_pull_secret |
Image pull secret for private registries | "" |
precheck |
Run prechecks before installation | true |
kubeslice_precheck |
Run KubeSlice-specific prechecks | true |
verify_install |
Verify installations globally | false |
verify_install_timeout |
Verification timeout (seconds) | 600 |
use_local_charts |
Use local Helm charts | true |
local_charts_path |
Path to local charts | "charts" |
helm_flags |
Additional Helm flags | "--debug" |
enable_troubleshoot |
Enable troubleshooting mode | false |
📖 See egs-installer-config.yaml for all available options.
Step 11: Run Installation
./egs-installer.sh --input-yaml egs-installer-config.yaml
Step 12: Access the EGS UI
After successful installation, access the EGS UI.
📝 Note: The installer script output will display the UI URL and access token automatically at the end of installation. The steps below are for manual access if you need to retrieve these details later.
Script Output Example
At the end of installation, the script displays access information like this:
┌─────────────────────────────────────────────────────────────────────────────────────┐
│                         🌐 KUBESLICE UI ACCESS INFORMATION                          │
├─────────────────────────────────────────────────────────────────────────────────────┤
│ Service Type: ⚖️  LoadBalancer                                                      │
│ Access URL  : 🔗 https://<EXTERNAL-IP>                                              │
│ Status      : ✅ Ready for external access via LoadBalancer                         │
└─────────────────────────────────────────────────────────────────────────────────────┘

┌─────────────────────────────────────────────────────────────────────────────────────┐
│                        🔐 KUBESLICE PROJECT ACCESS TOKENS                           │
├─────────────────────────────────────────────────────────────────────────────────────┤
│ 🔑 TOKEN: ✅ Available                                                              │
│                                                                                     │
├─────────────────────────────────────────────────────────────────────────────────────┤
eyJhbGciOiJSUzI1NiIsImtpZCI6....<TOKEN>....                                           │
├─────────────────────────────────────────────────────────────────────────────────────┤
│ 💡 USAGE: 📋 COPY THE ABOVE TOKEN AND PASTE IT ON PLACE OF ENTER SERVICE            │
│              ACCOUNT TOKEN IN BROWSER                                               │
└─────────────────────────────────────────────────────────────────────────────────────┘

┌─────────────────────────────────────────────────────────────────────────────────────┐
│                          🏁 INSTALLATION SUMMARY COMPLETE                           │
├─────────────────────────────────────────────────────────────────────────────────────┤
│ ✅ All configured components have been processed.                                   │
│ 📋 Access information displayed above for quick reference.                          │
│ 🔧 For troubleshooting, check logs in file egs-installer-output.log                 │
│ 📚 Refer to documentation https://docs.avesha.io/documentation/enterprise-egs       │
└─────────────────────────────────────────────────────────────────────────────────────┘
Simply copy the Access URL and Token from the script output to access the UI.
Manual Access (If Needed)
If you need to retrieve the UI access details manually (e.g., after the script has finished), follow these steps:
1. Get the UI URL
# Get the UI service external IP/hostname
kubectl get svc kubeslice-ui-proxy -n kubeslice-controller

# Example output:
# NAME                 TYPE           CLUSTER-IP     EXTERNAL-IP      PORT(S)
# kubeslice-ui-proxy   LoadBalancer   10.x.x.x       <EXTERNAL-IP>    443:xxxxx/TCP
Access the UI at: https://<EXTERNAL-IP>
2. Get the Admin Token
# Get the admin token for login (use absolute path to kubeconfig)
./fetch_egs_slice_token.sh -k /path/to/kubeconfig -p avesha -a -u admin
The script will output the admin token. Copy and paste it into the UI login screen.
Parameters:
-k /path/to/kubeconfig: Absolute path to your kubeconfig file-p avesha: Project name (default:avesha)-a: Fetch admin token-u admin: Username for the admin token
3. Quick Token Retrieval (Alternative)
# Direct token retrieval using kubectl
kubectl get secret kubeslice-rbac-rw-admin -n kubeslice-avesha -o jsonpath='{.data.token}' | base64 -d
📖 For detailed token retrieval options: See Slice & Admin Token Guide
4. EGS UI Screenshots
After logging in, you’ll have access to the following screens. Click on any screenshot to expand:
| 🖼️ Screenshot | Description | Click to View |
|---|---|---|
| 🔐 Login Page | Enter your service account token to access EGS | <summary>👁️ View Screenshot</summary> 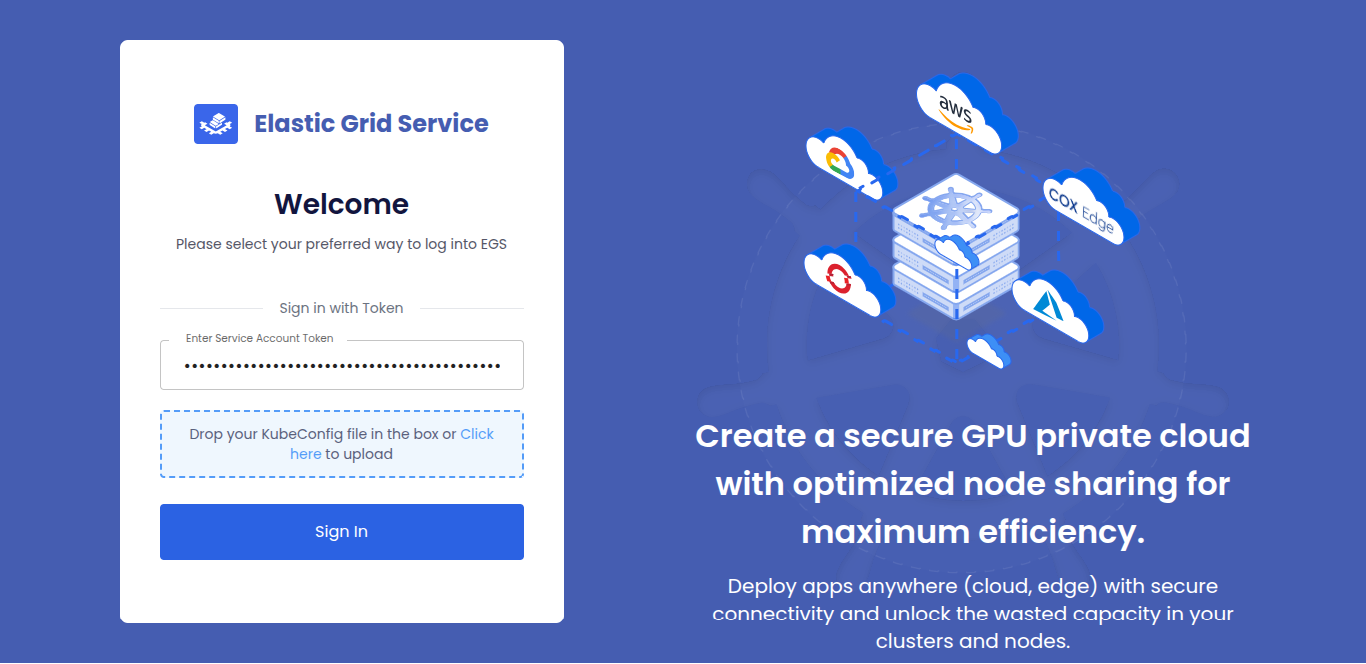 |
| 📊 Dashboard Overview | GPU allocation and utilization at a glance | <summary>👁️ View Screenshot</summary> 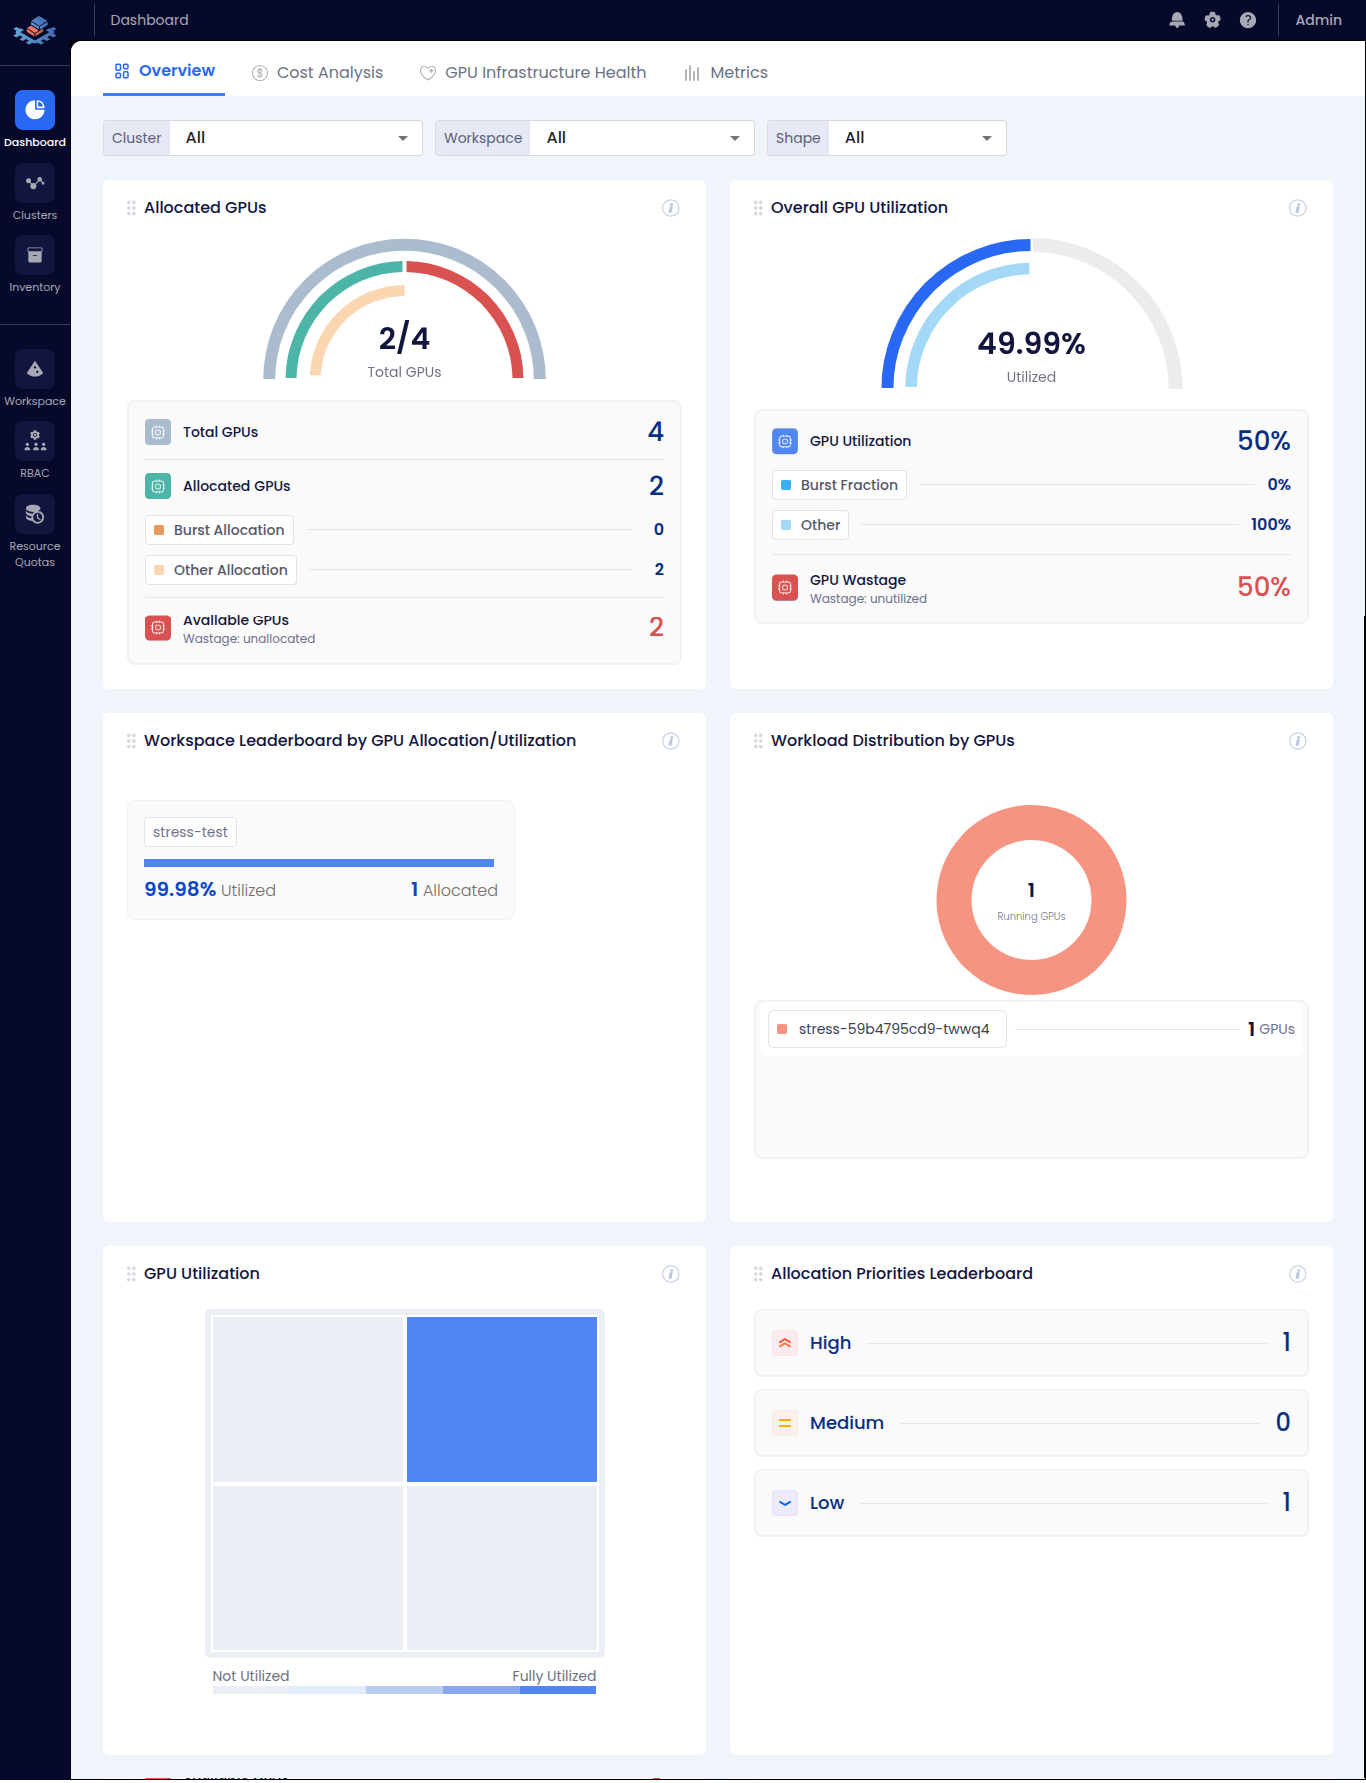 |
| 💰 Cost Analysis | GPU cost breakdown and utilization costs | <summary>👁️ View Screenshot</summary> 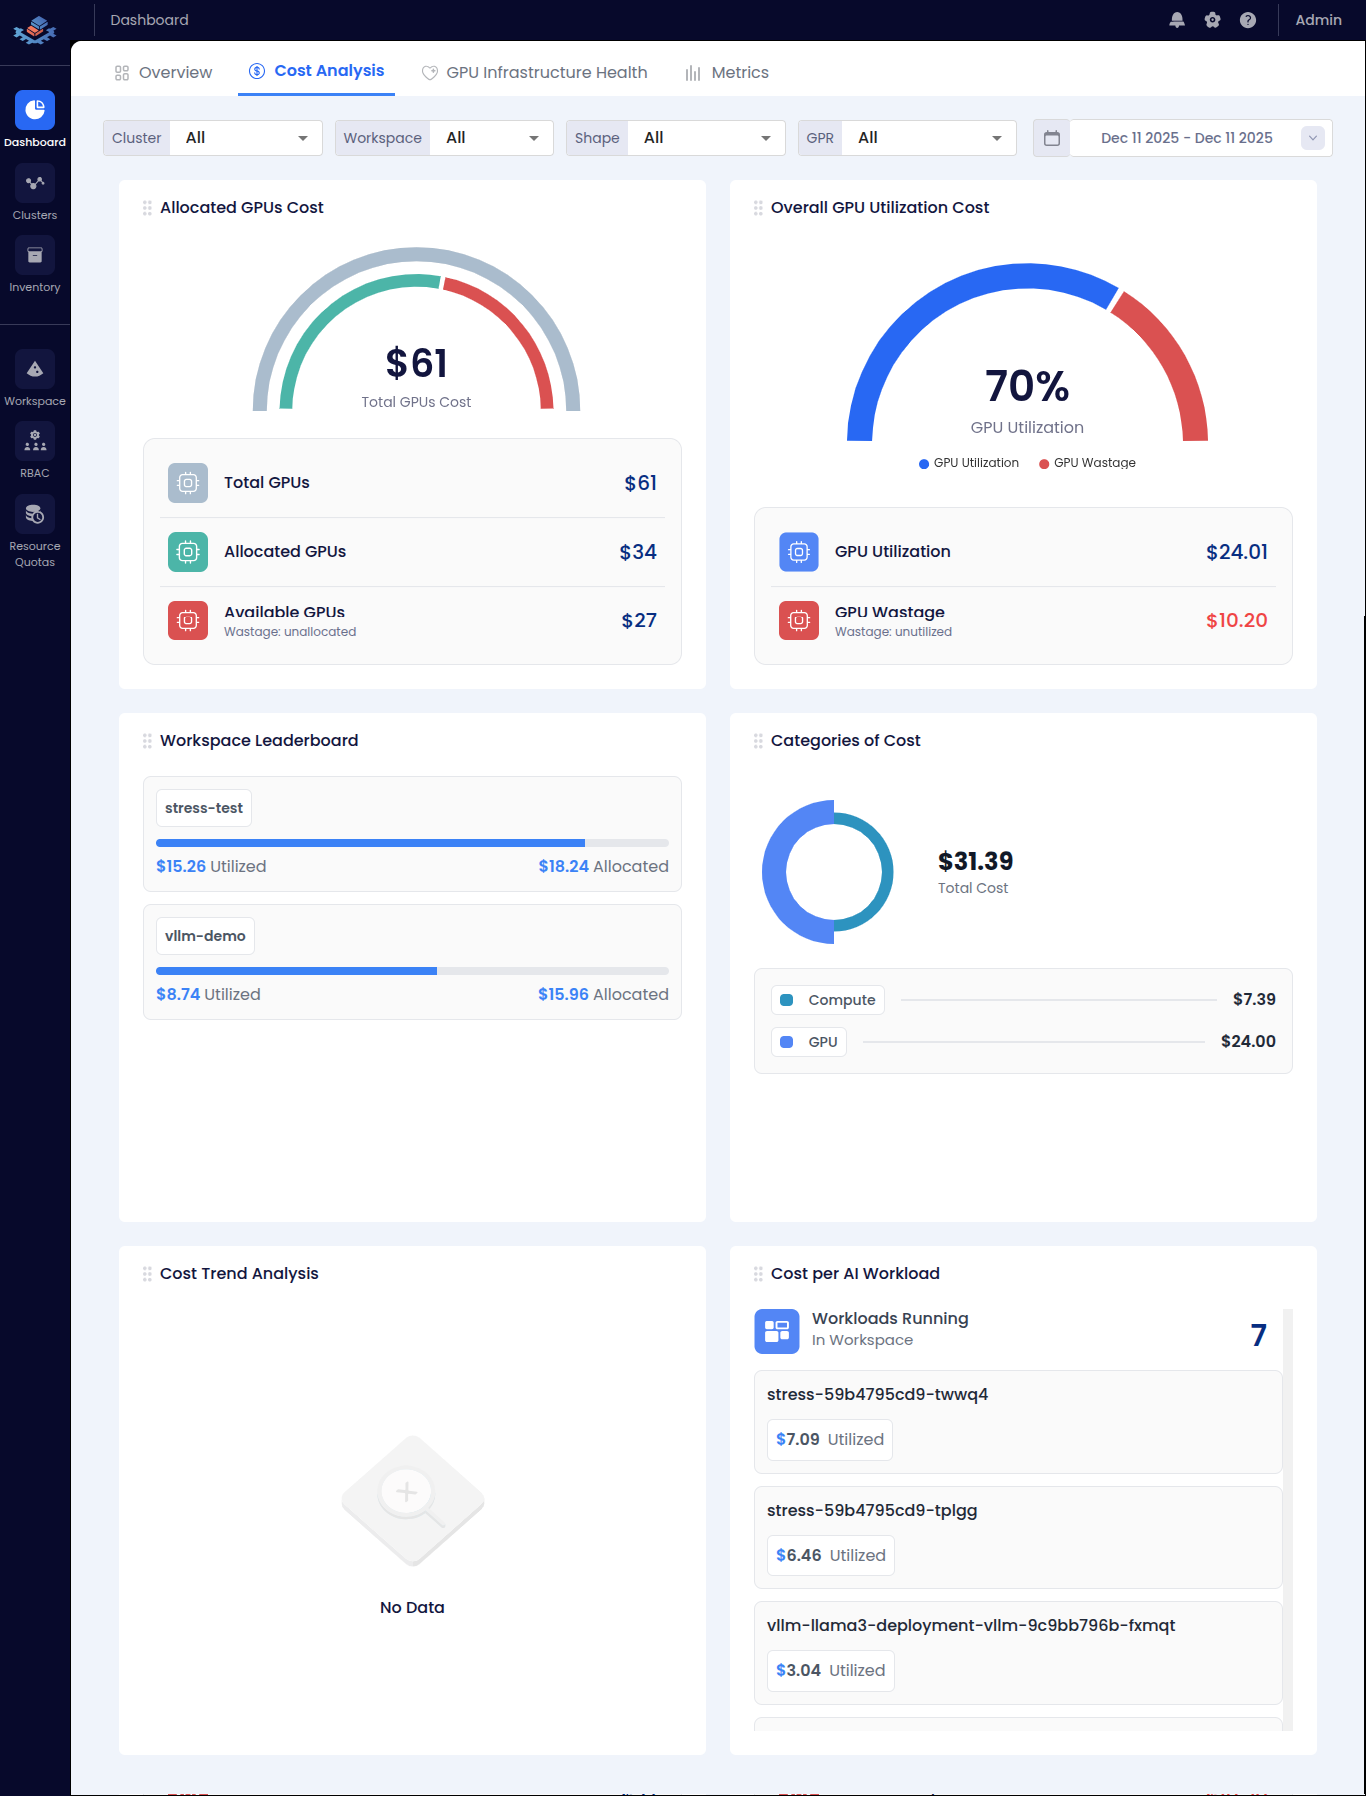 |
| 🔧 GPU Health | Power usage, temperature, and memory trends | <summary>👁️ View Screenshot</summary> 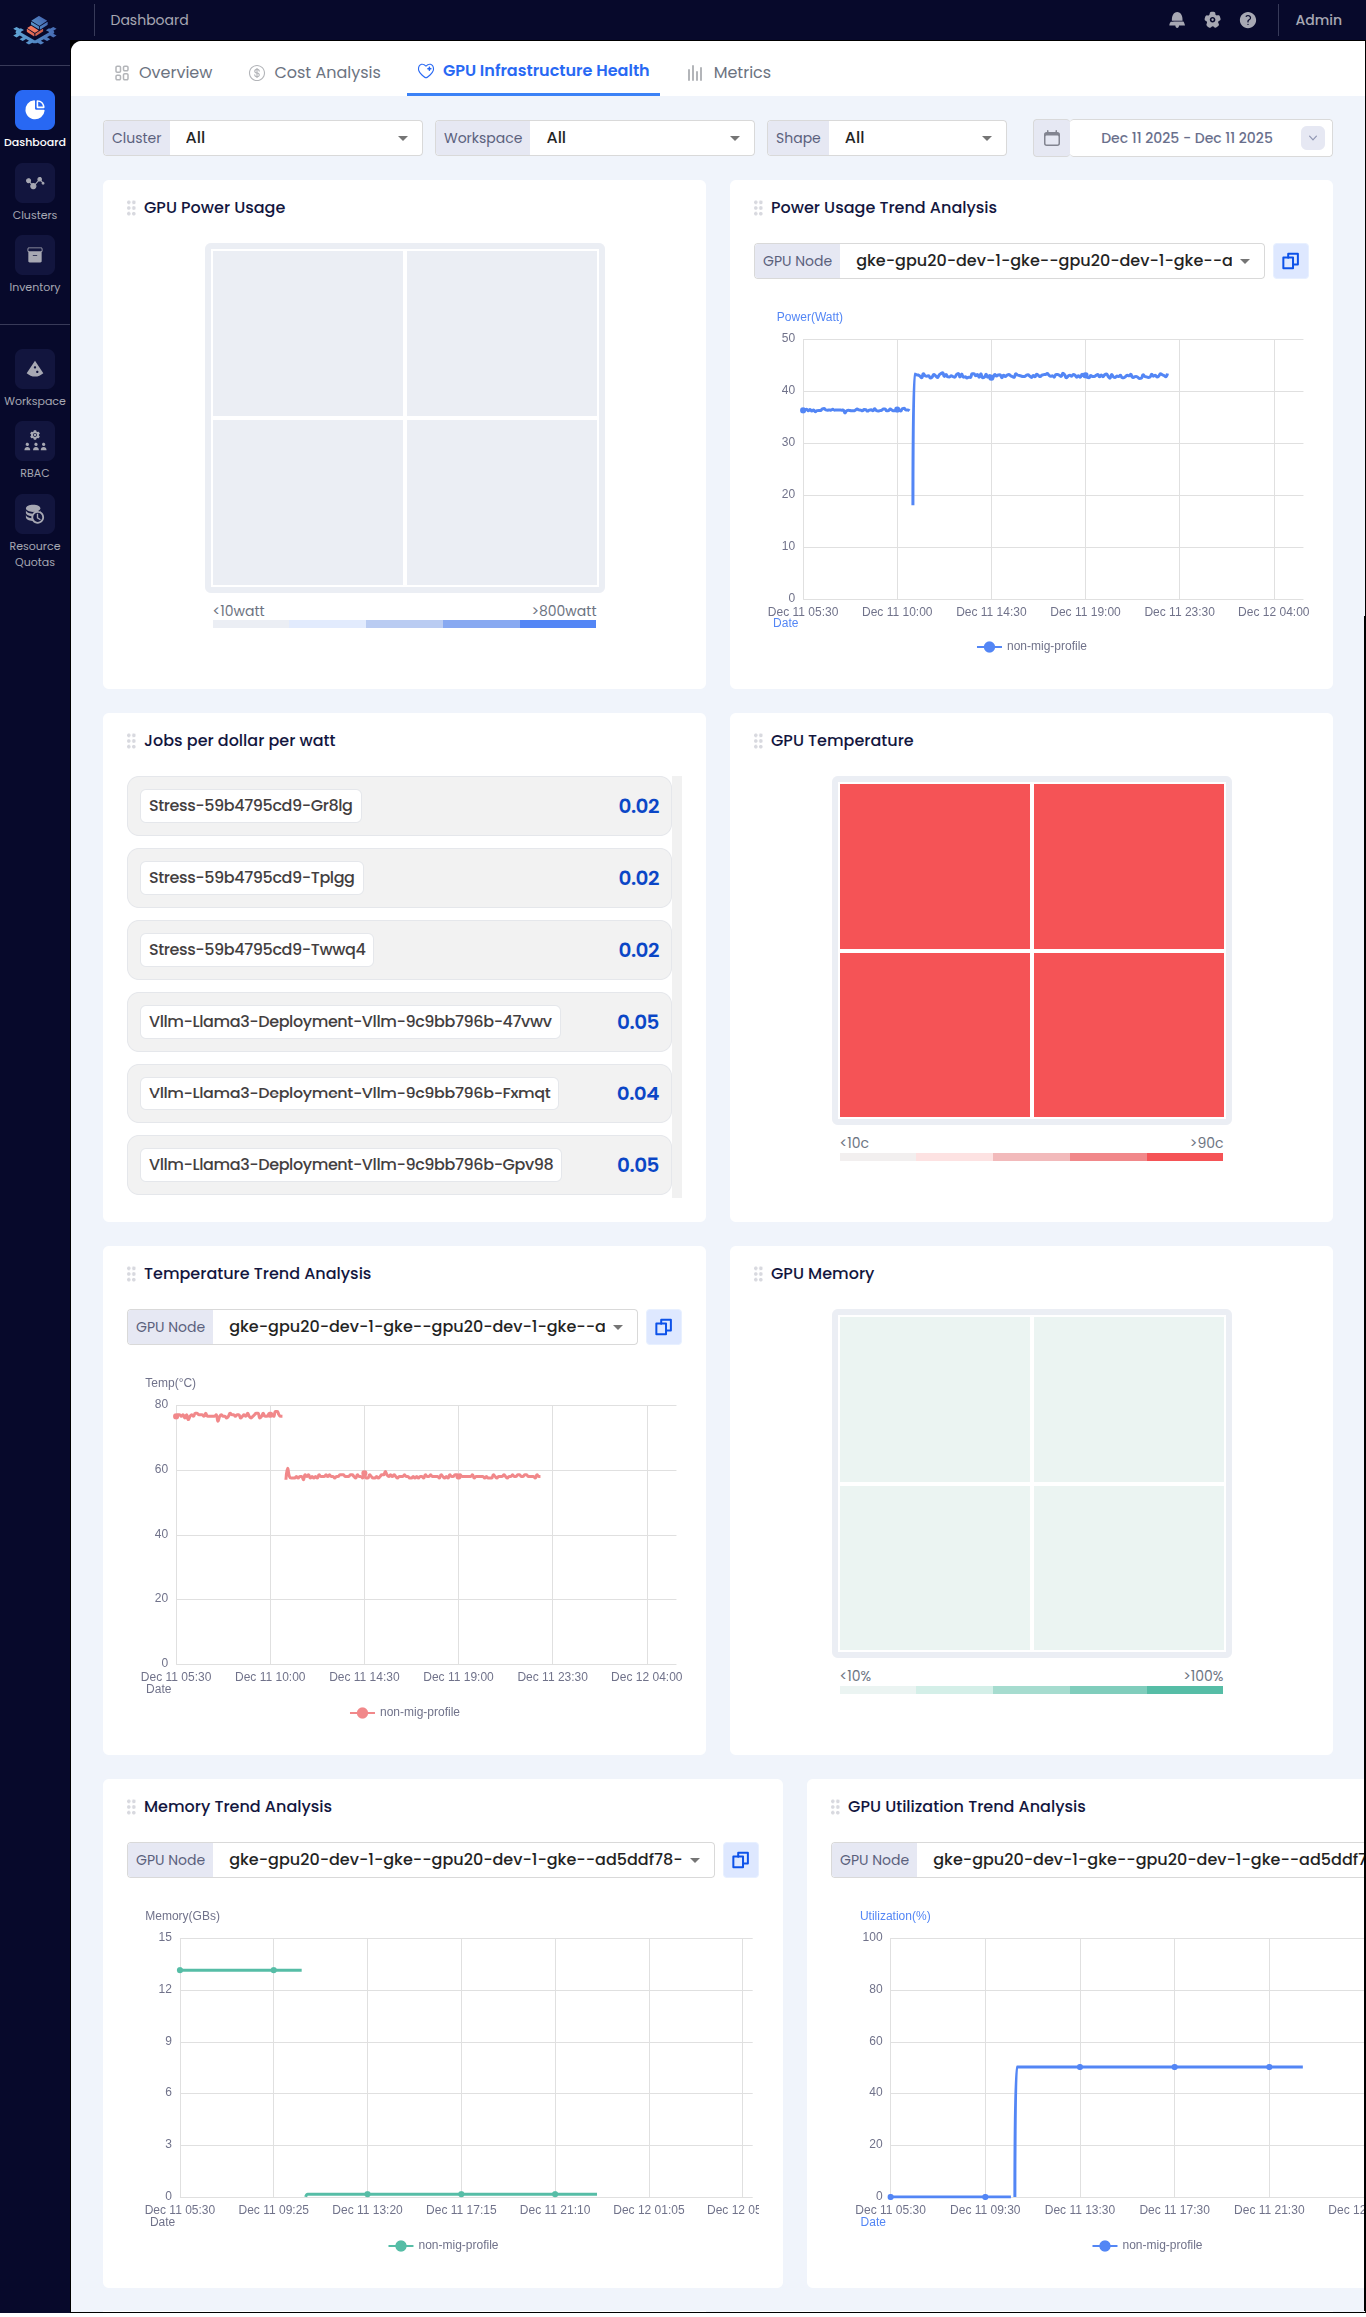 |
| 📈 Metrics | Workspace metrics and cluster visualization | <summary>👁️ View Screenshot</summary> 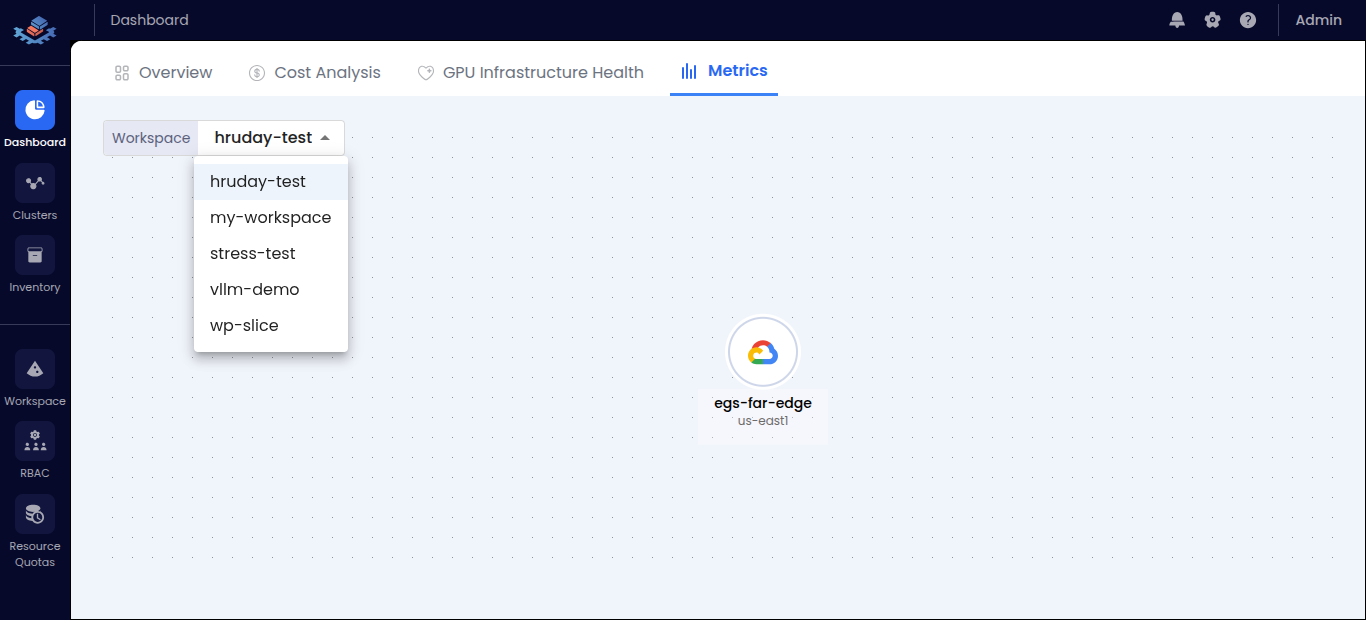 |
| 🖥️ Clusters | Registered clusters with status and health | <summary>👁️ View Screenshot</summary> 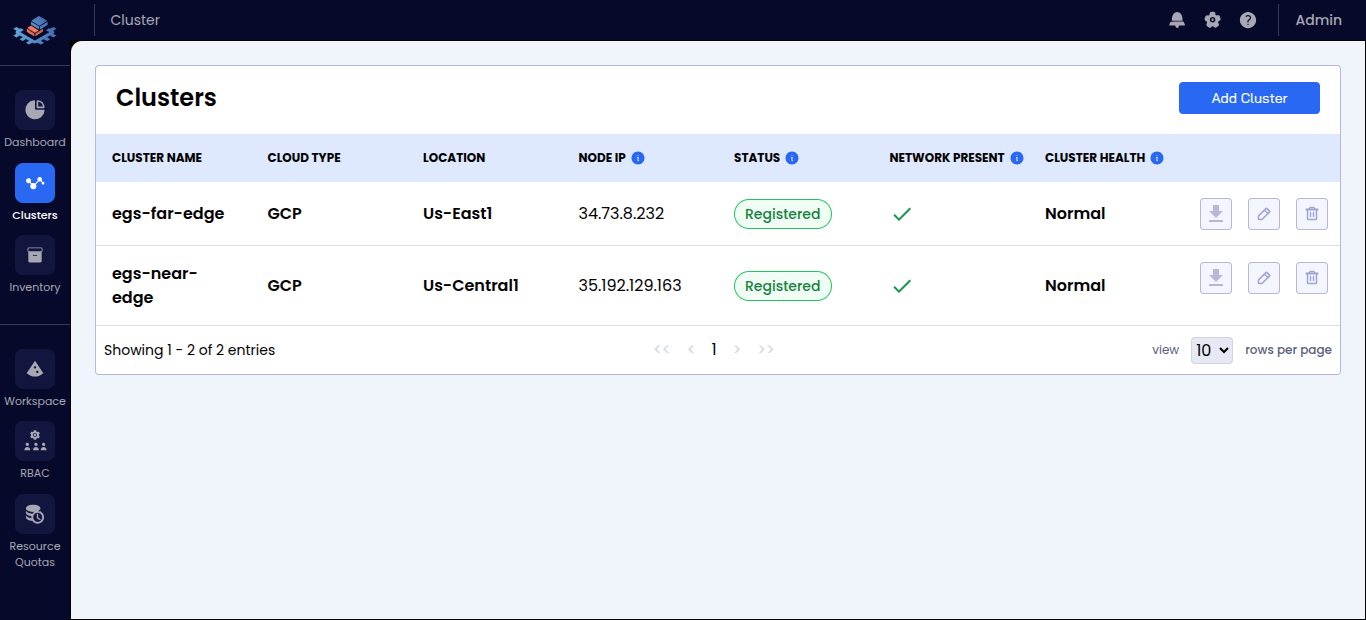 |
| 📦 Inventory | Managed GPU nodes across clusters | <summary>👁️ View Screenshot</summary> 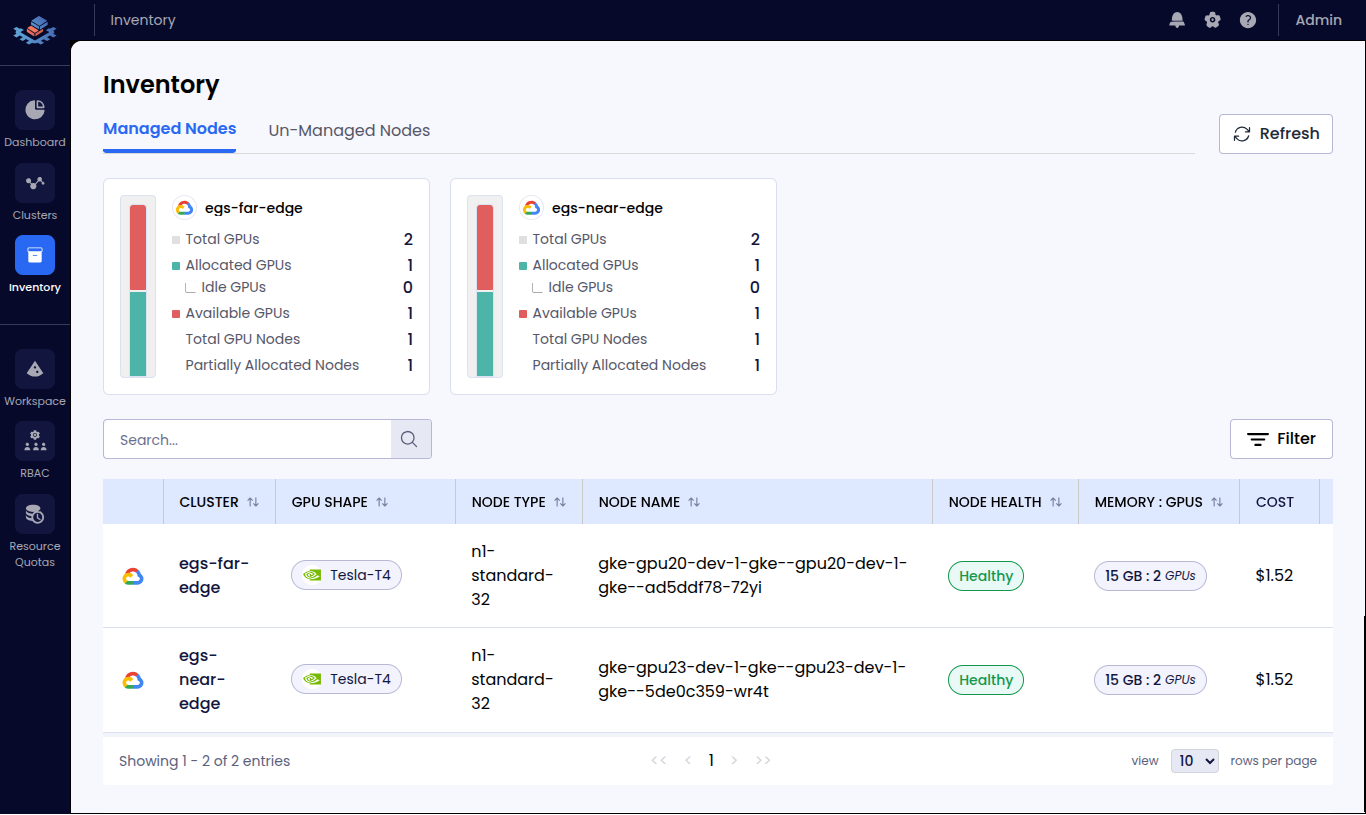 |
| 🗂️ Workspaces | Application workspaces and configurations | <summary>👁️ View Screenshot</summary> 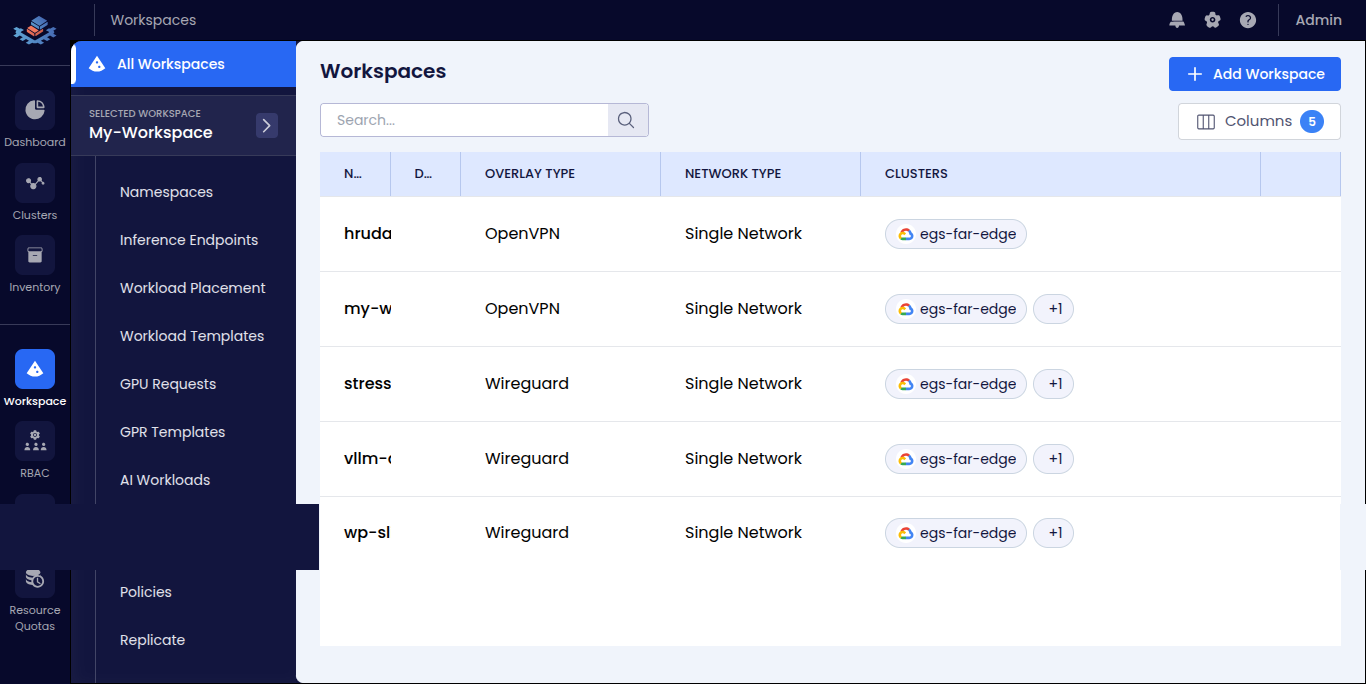 |
| 👥 RBAC | Role-based access control for workspaces | <summary>👁️ View Screenshot</summary> 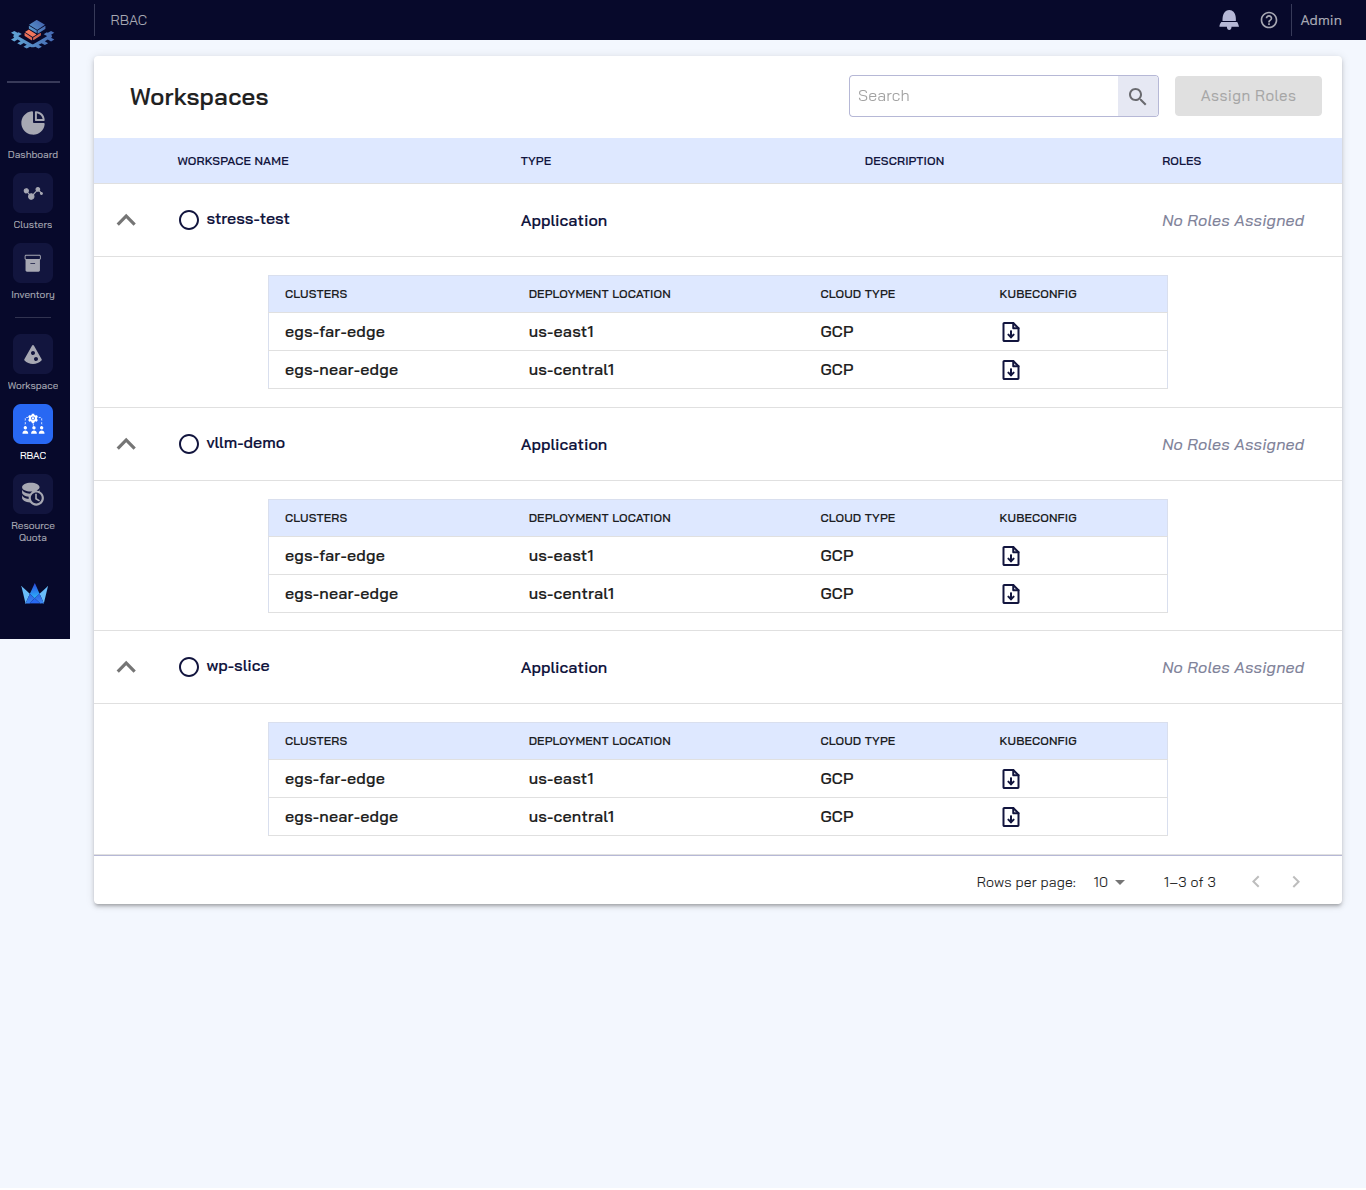 |
| 📋 Resource Quotas | Workspace resource limits and allocations | <summary>👁️ View Screenshot</summary> 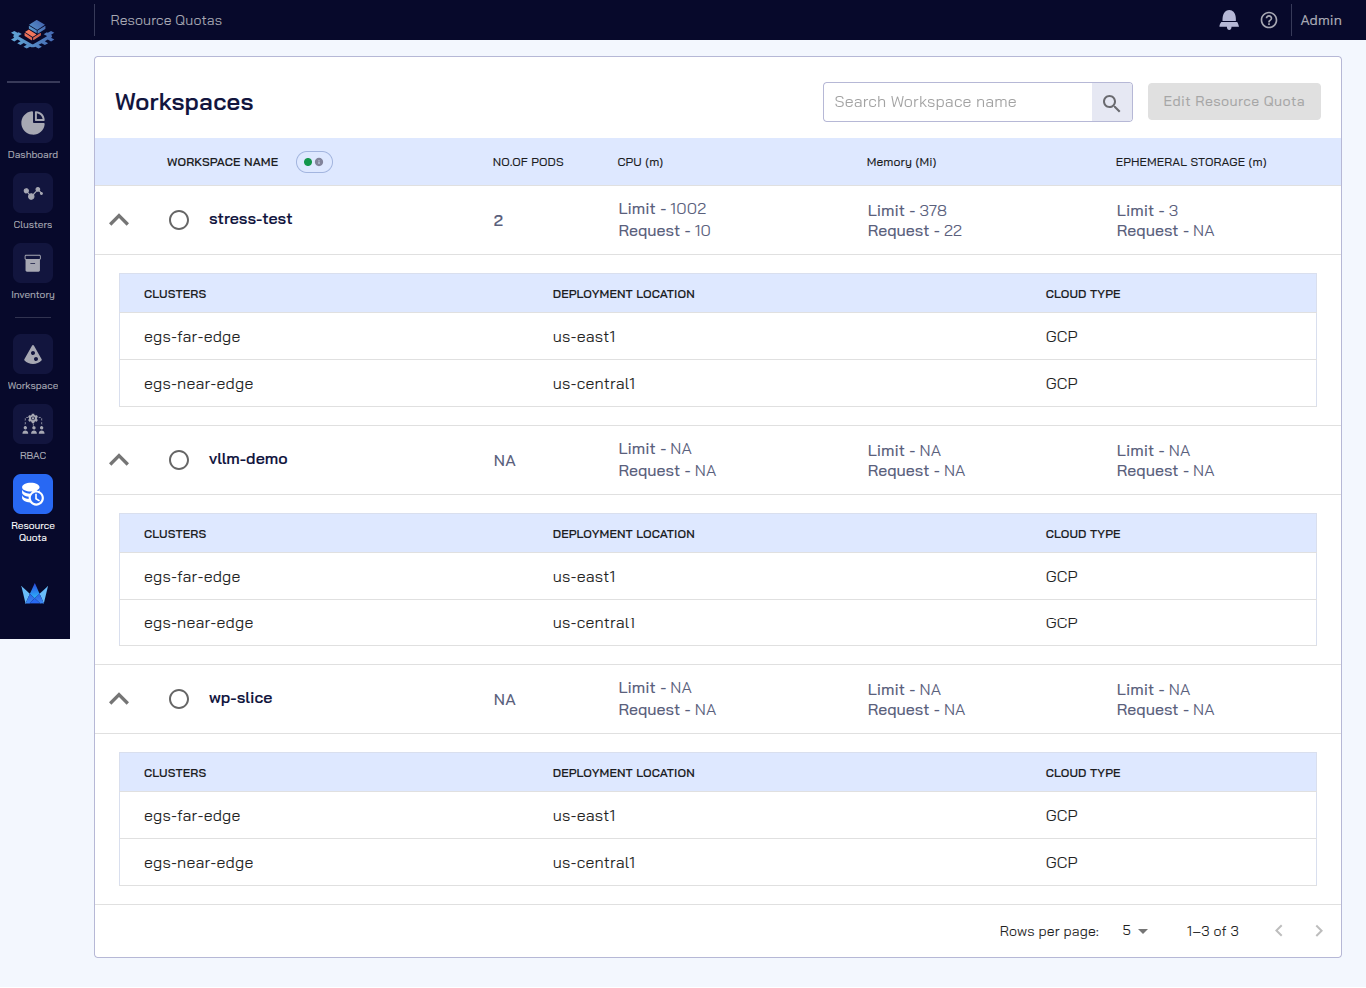 |
🌐 Multi-Cluster Setup
For multi-cluster deployments with workers in different clusters:
Key Configuration Differences
| Setting | Single-Cluster | Multi-Cluster |
|---|---|---|
use_global_kubeconfig |
true |
false (per-worker) |
Worker kubeconfig |
Empty (uses global) | Worker-specific path |
| Prometheus endpoint | *.svc.cluster.local |
LoadBalancer/NodePort IP |
| Grafana endpoint | *.svc.cluster.local |
LoadBalancer/NodePort IP |
Multi-Cluster Worker Configuration
kubeslice_worker_egs:
  - name: "worker-1"
    use_global_kubeconfig: false               # Do NOT use global kubeconfig
    kubeconfig: "worker-1-kubeconfig.yaml"     # Path to worker-1 specific kubeconfig
    kubecontext: "worker-1-context"            # Context name in the kubeconfig file
    skip_installation: false
    specific_use_local_charts: true
    namespace: "kubeslice-system"
    release: "egs-worker"
    chart: "kubeslice-worker-egs"
    inline_values:
      egs:
        prometheusEndpoint: "http://<worker-1-prometheus-lb>:9090"  # External endpoint
        grafanaDashboardBaseUrl: "http://<worker-1-grafana-lb>/d/Oxed_c6Wz"
    # ... other values

  - name: "worker-2"
    use_global_kubeconfig: false               # Do NOT use global kubeconfig
    kubeconfig: "worker-2-kubeconfig.yaml"     # Path to worker-2 specific kubeconfig
    kubecontext: "worker-2-context"            # Context name in the kubeconfig file
    skip_installation: false
    specific_use_local_charts: true
    namespace: "kubeslice-system"
    release: "egs-worker-2"                    # Unique release name
    chart: "kubeslice-worker-egs"
    inline_values:
      egs:
        prometheusEndpoint: "http://<worker-2-prometheus-lb>:9090"  # External endpoint
        grafanaDashboardBaseUrl: "http://<worker-2-grafana-lb>/d/Oxed_c6Wz"
    # ... other values
Adding Additional Workers
To add more workers, follow these steps:
Step 1: Add a new entry in kubeslice_worker_egs array with:
- Unique
nameandreleasevalues - Worker-specific
kubeconfigandkubecontext - Correct monitoring endpoints
Step 2: Add corresponding cluster_registration entry:
cluster_registration:
  - cluster_name: "worker-1"
    project_name: "avesha"
    telemetry:
      enabled: true
      endpoint: "http://<worker-1-prometheus-lb>:9090"  # Must be accessible from controller
      telemetryProvider: "prometheus"
    geoLocation:
      cloudProvider: "GCP"
      cloudRegion: "us-west1"

  - cluster_name: "worker-2"
    project_name: "avesha"
    telemetry:
      enabled: true
      endpoint: "http://<worker-2-prometheus-lb>:9090"  # Must be accessible from controller
      telemetryProvider: "prometheus"
    geoLocation:
      cloudProvider: "AWS"
      cloudRegion: "us-east-1"
⚠️ Critical: For multi-cluster, Prometheus endpoints must be externally accessible (LoadBalancer/NodePort), not *.svc.cluster.local.
📖 See Multi-Cluster Installation Example for complete configuration.
🗑️ Uninstallation
⚠️ Warning: This removes all EGS resources including slices, GPRs, and custom resources.
./egs-uninstall.sh --input-yaml egs-installer-config.yaml
📋 Quick Reference
Installation Methods Comparison
| Feature | Quick Installer | Config-Based |
|---|---|---|
| Setup Time | Minutes | Varies |
| Configuration | Flags | YAML file |
| Multi-cluster | Supported | Supported |
| Version Control | Generated config | Full control |
| Best For | PoC, new users | Production |
Common Operations
| # | Operation | Command |
|---|---|---|
| 1 | Preflight check | ./egs-preflight-check.sh --kubeconfig ~/.kube/config |
| 2 | Prerequisites only | ./egs-install-prerequisites.sh --input-yaml egs-installer-config.yaml |
| 3 | Full installation | ./egs-installer.sh --input-yaml egs-installer-config.yaml |
| 4 | Uninstall | ./egs-uninstall.sh --input-yaml egs-installer-config.yaml |
📦 Airgap Deployment
For airgap/offline deployments where clusters don’t have internet access, EGS provides scripts to manage container images:
- Extract Images: Use
airgap-image-pull.shto extract all container images from EGS Helm charts - Push to Private Registry: Use
airgap-image-push.shto push images to your private registry (Docker Hub, Nexus, etc.)
The scripts support both Docker Hub and private registries like Nexus, with auto-detection of registry type.
👉 For detailed instructions, see Airgap Image Management Documentation